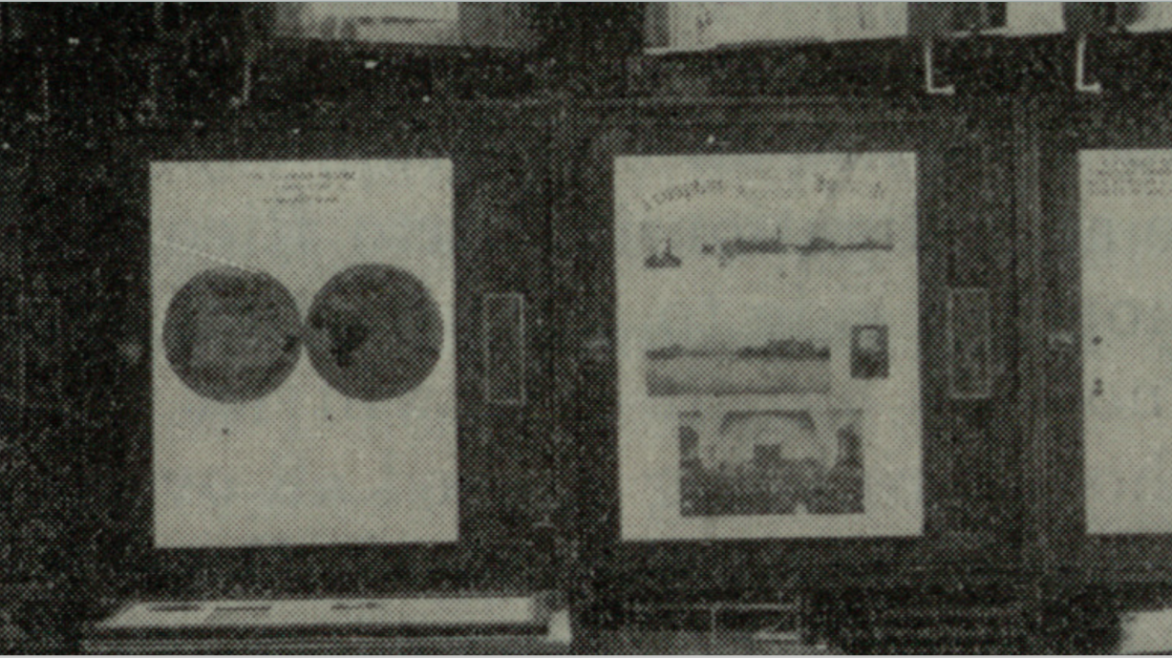
In celebration of Black History Month 2022, the Baltimore Mayor’s Office of Performance and Innovation (OPI) created a series of data visualizations inspired by W.E.B. Du Bois’s groundbreaking work at the 1900 Paris Exposition. Du Bois’s visualizations illuminated the complexities of African American life, showcasing achievements and highlighting systemic challenges.
Analysts from OPI reimagined key visualizations using contemporary data to tell modern stories about Black America. Each analyst reflected on their work and the personal significance of the data. Here are some key contributions:
- Joale Jupiter focused on the representation of Black Americans in the U.S. population, emphasizing the importance of understanding context beyond mere numbers. She highlighted her family’s journey from sharecroppers to landowners, reflecting the broader progress of the Black community.
- Justin Elszasz recreated a visualization on the demographics of Black and Brown populations, revealing stagnation in Baltimore’s Black population since 1970 and the historical context of urban de-urbanization.
- Melanie Rogala examined the legacy of the 13th Amendment and its implications for modern slavery, particularly through the lens of mass incarceration and its disproportionate impact on Black communities.
- Dan Hennessey illustrated trends in Black household wealth, linking historical data on furniture ownership to current net worth metrics while addressing the impacts of discriminatory policies.
- Monica Nimmagadda charted the dramatic increase in Black children’s enrollment in public schools, contextualizing this growth against the backdrop of historical events and contemporary challenges like the COVID-19 pandemic.
- Quilvio Hernandez analyzed employment opportunities, noting the progress made since Du Bois’s time while recognizing ongoing disparities that persist.
- Jeanette Perthel visualized Black homeownership and property values in Baltimore and Prince George’s County, showing both growth in some areas and decline in others, highlighting demographic shifts.
- Jordan Barry explored marital status trends among Black residents, noting changes over time and the need for deeper analysis to understand equity outcomes.
These modern visualizations honor Du Bois’s legacy by revealing the complexity of Black life in America today, encouraging viewers to appreciate progress while acknowledging ongoing struggles. The project demonstrates the power of data to tell stories, foster understanding, and inspire action.


